Ehcache Monitor
NOTE: The Ehcache Monitor was discontinue several years ago and is no longer avaailable since 2016.
NOTE: The Terracotta Management Console is now available for standalone enterprise Ehcache and replaces Ehcache Monitor for monitoring, management, and administration. For download instructions, contact [email protected].
Introduction
The Ehcache Monitor is an add-on tool for Ehcache provides enterprise-class monitoring and management capabilities for use in both development and production. It is intended to help understand and tune cache usage, detect errors, and provide an easy to use access point to integrate with production management systems. It also provides administrative functionality such as the ability to forcefully remove items from caches.
To install the Monitor, add the Monitor Probe JAR to your app and a few lines of config in ehcache.xml. The package contains a probe and a server. The probe installs with your existing Ehcache cache instance, and communicates to a central server. The server aggregates data from multiple probes. It can be accessed via a simple web UI, as well as a scriptable API. In this way, it is easy to integrate with common third party systems management tools (such as Hyperic, Nagios etc). The probe is designed to be compatible with all versions of Ehcache from 1.5 and requires JDK 1.6.
Installation And Configuration
First download and extract the Ehcache Monitor package. The package consists of a lib directory with the probe and monitor server jars, a bin directory with startup and shutdown scripts for the monitor server and an etc directory with an example monitor server configuration file and a Jetty Server configuration file.
Recommended Deployment Topology
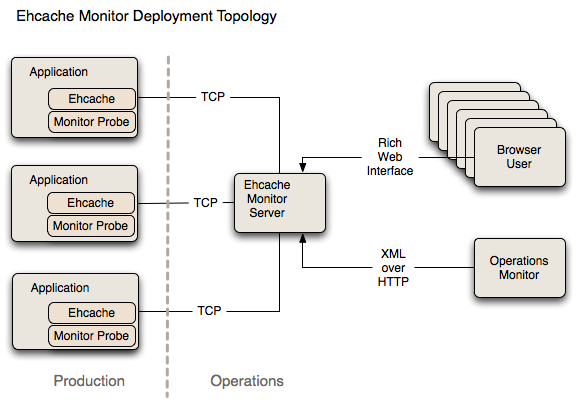
It is recommended that you install the Monitor on an Operations server separate to production. The Monitor acts as an aggregation point for access by end users and for scripted connection from Operations tools for data feeds and set up of alerts.
Probe
To include the probe in your Ehcache application, you need to perform two steps:
-
Add the ehcache-probe-
.jar to your application classpath (or war file). Do this in the same way you added the core ehcache jar to your application. If you are Maven based, the probe module is in the Terracotta public repository for easy integration. <repository> <id>terracotta-releases</id> <url>http://www.terracotta.org/download/reflector/releases</url> </repository> <dependency> <groupId>org.terracotta</groupId> <artifactId>ehcache-probe</artifactId> <version>[version]</version> </dependency> -
Configure Ehcache to communicate with the probe by specifying the class name of the probe, the address (or hostname), the port that the monitor will be running on and whether to do memory measurement. This is done by adding the following to ehcache.xml:
<cacheManagerPeerListenerFactory class="org.terracotta.ehcachedx.monitor.probe.ProbePeerListenerFactory" properties="monitorAddress=localhost, monitorPort=9889, memoryMeasurement=true" /> -
Include required SLF4J logging jars.
Ehcache 1.7.1 and above require SLF4J. Earlier versions used commons logging. The probe, like all new Ehcache modules, uses SLF4J, which is becoming a new standard in open source projects.
If you are using Ehcache 1.5 to 1.7.0, you will need to add slf4j-api and one concrete logger. If you are using Ehcache 1.7.1 and above you should not need to do anything because you will already be using slf4j-api and one concrete logger.
More information on SLF4J is available from http://www.slf4j.org.
-
Ensure that statistics capture in each cache is turned on for the probe to gather statistics. Statistics were turned off by default from Ehcache 2.1 onwards.
 <cache name="sampleCache2"
   maxEntriesLocalHeap="1000"
   eternal="true"
   overflowToDisk="false"
   memoryStoreEvictionPolicy="FIFO"
   statistics="true"
   />
Starting the Monitor
Copy the monitor package to a monitoring server.
To start the monitor, run the startup script provided in the bin directory: startup.sh on Unix and startup.bat on Microsoft Windows.
NOTE: If errors occur at startup, remove the line -j "$PRGDIR/etc/jetty.xml" \ (or -j %PRGDIR%\etc\jetty.xml ^) from the startup script.
The monitor port selected in this script should match the port specified in ehcache.xml. The monitor can be configured, including interface, port and simple security settings, in etc/ehcache-monitor.conf. Note that for the commercial version, the location of your license file must be specified in ehcache-monitor.conf.
For example:
license_file=/Users/karthik/Documents/workspace/lib/license/terracotta-license.key
The monitor connection timeout can also be configured. If the monitor is frequently timing out while attempting to connect to a node (due to long GC cycles, for example), then the default timeout value may not be suitable for your environment. You can set the monitor timeout using the system property ehcachedx.connection.timeout.seconds. For example, -Dehcachedx.connection.timeout.seconds=60 sets the timeout to 60 seconds.
Securing the Monitor
The Monitor can be secured in a variety of ways. The simplest method involves simply editing ehcache-monitor.conf to specify a single user name and password. This method has the obvious drawbacks that (1) it provides only a single login identity, and (2)
the credentials are stored in clear-text.
A more comprehensive security solution can be achieved by configuring the Jetty Server with one ore more UserRealms as described by Jetty and JAAS. Simply edit etc/jetty.xml to use the appropriate UserRealm implementation for your needs. To configure the Monitor to authenticate against an existing LDAP server, first ensure that you have
defined and properly registered a LoginConfig, such as the following example:
         MyExistingLDAPLoginConfig {
  com.sun.security.auth.module.LdapLoginModule REQUIRED
  java.naming.security.authentication="simple"
  userProvider="ldap://ldap-host:389"
  authIdentity="uid={USERNAME},ou=People,dc=myorg,dc=org"
  useSSL=false
  bindDn="cn=Manager"
  bindCredential="secretBindCredential"
  bindAuthenticationType="simple"
  debug=true;
};
Note: the LdapLoginModule is new with JDK 1.6.
JAAS supports many different types of login modules and it is up to the user to provide a valid, working JAAS environment. For information on how to register your LoginConfig refer to $JAVA_HOME/jre/lib/security/java.security.
Next, edit etc/jetty.xml:
         <?xml version="1.0"?>
<!DOCTYPE Configure PUBLIC "-//Mort Bay Consulting//DTD Configure//EN"
 "http://jetty.mortbay.org/configure.dtd">
<Configure id="Server" class="org.terracotta.ehcachedx.org.mortbay.jetty.Server">
  <Set name="UserRealms">
    <Array type="org.terracotta.ehcachedx.org.mortbay.jetty.security.UserRealm">
      <Item>
        <New class="org.terracotta.ehcachedx.org.mortbay.jetty.plus.jaas.JAASUserRealm">
          <Set name="Name">MyArbitraryLDAPRealmName</Set>
          <Set name="LoginModuleName">MyExistingLDAPLoginConfig</Set>
        </New>
      </Item>
    </Array>
  </Set>
</Configure>
The LoginModuleName you specify as the second constructor parameter to the JAASUserRealm class must exactly match the name of your LoginModule. The realm name specified as the first constructor parameter can be an arbitrary value.
Note: the version of Jetty used in the Monitor has been repackaged so be sure to prefix any standard Jetty class names with org.terracotta.ehcachedx.
If the Jetty Server is found to have been configured with any security realms, the simple user name and password from ehcache-monitor.conf is ignored.
Using the Web GUI
The web-based GUI is available by pointing your browser at http://
Cache Managers
This tab shows aggregate statistics for the cache managers being monitored by probes connected to the monitor server. Double-clicking on any cache manager drills down to the detailed Statistics tab for that manager.
Statistics
This tab shows the statistics being gathered for each cache managed by the selected cache manager. The Settings button permits you to add additional statistics fields to the display. Note: only displayed fields are collected and aggregated by the probe. Adding additional display fields will increase the processing required for probe and the monitor. The selected settings are stored in a preferences cookie in your browser. Double-clicking on any cache drills down to the Contents tab for that cache.
Configuration
This tab shows the key configuration information for each cache managed by the selected cache manager.
Contents
This tab enables you to look inside the cache, search for elements via their keys and remove individual or groups of elements from the cache. The GUI is set to refresh at the same frequency that the probes aggregate their statistic samples which is every 10 seconds by default. The progress bar at the bottom of the screen indicates the time until the next refresh.
Charts
This tab contains various live charts of cache statistics. It gives you a feel for the trending of the each statistic, rather than just the latest value.
Estimated Memory Use Chart
This chart shows the estimated memory use of the Cache. Memory is estimated by sampling. The first 15 puts or updates are measured and then every 100th put or update. Most caches contain objects of similar size. If this is not the case for your cache, then the estimate will not be accurate. Measurements are performed by walking the object graph of sampled elements through reflection. In some cases such as classes not visible to the classloader, the measurement fails and 0 is recorded for cache size. If you see a chart with 0 memory size values but the cache has data in it, then this is the cause. For this release, caches distributed via Terracotta server show as 0.
API
This tab contains a listing of the API methods. Each is a hyperlink, which may be clicked on. Some will display data and some will require additional arguments. If additional arguments are required an error message will be displayed with the details. This tab is meant for iterative testing of the API.
Using the API
The Monitor provides a API over HTTP on the same port as the Web GUI.
The list of functions supported by the API can be accessed by pointing your browser at
http://
To query the data collected by the monitor server from scripts that can then be used to pass the data to enterprise system management
frameworks, commands such as curl or wget can be used.
For example, on a Linux system, to query the list of probes that a local monitor on the default port is currently aware of, and return
the data in XML format, the following command could be used:
$ curl http://localhost:9889/monitor/listProbes?format=xml
Licensing
Unless otherwise indicated, this module is licensed for usage in development. For details see the license terms in the appropriate LICENSE.txt. To obtain a commercial license for use in production, please contact [email protected]
Limitations
History not Implemented
This release has server side history configuration in place, however history is not implemented. It is anticipated it will be implemented in the next release. In the meantime, the charts with their recent history provide trending.
Memory Measurement limitations
Unfortunately in Java, there is no JSR for memory measurement of objects. Implementations, such as the sizeof one we use
are subject to fragilities.
For example, Java 7 memory measurement is not supported at this time. You will get a java.lang.NoSuchFieldException: header
exception message if you use memory measurement with Java 7.
Memory measurement can optionally be turned off by setting memoryMeasurement=false in the probe configuration.